01
Choose the right place
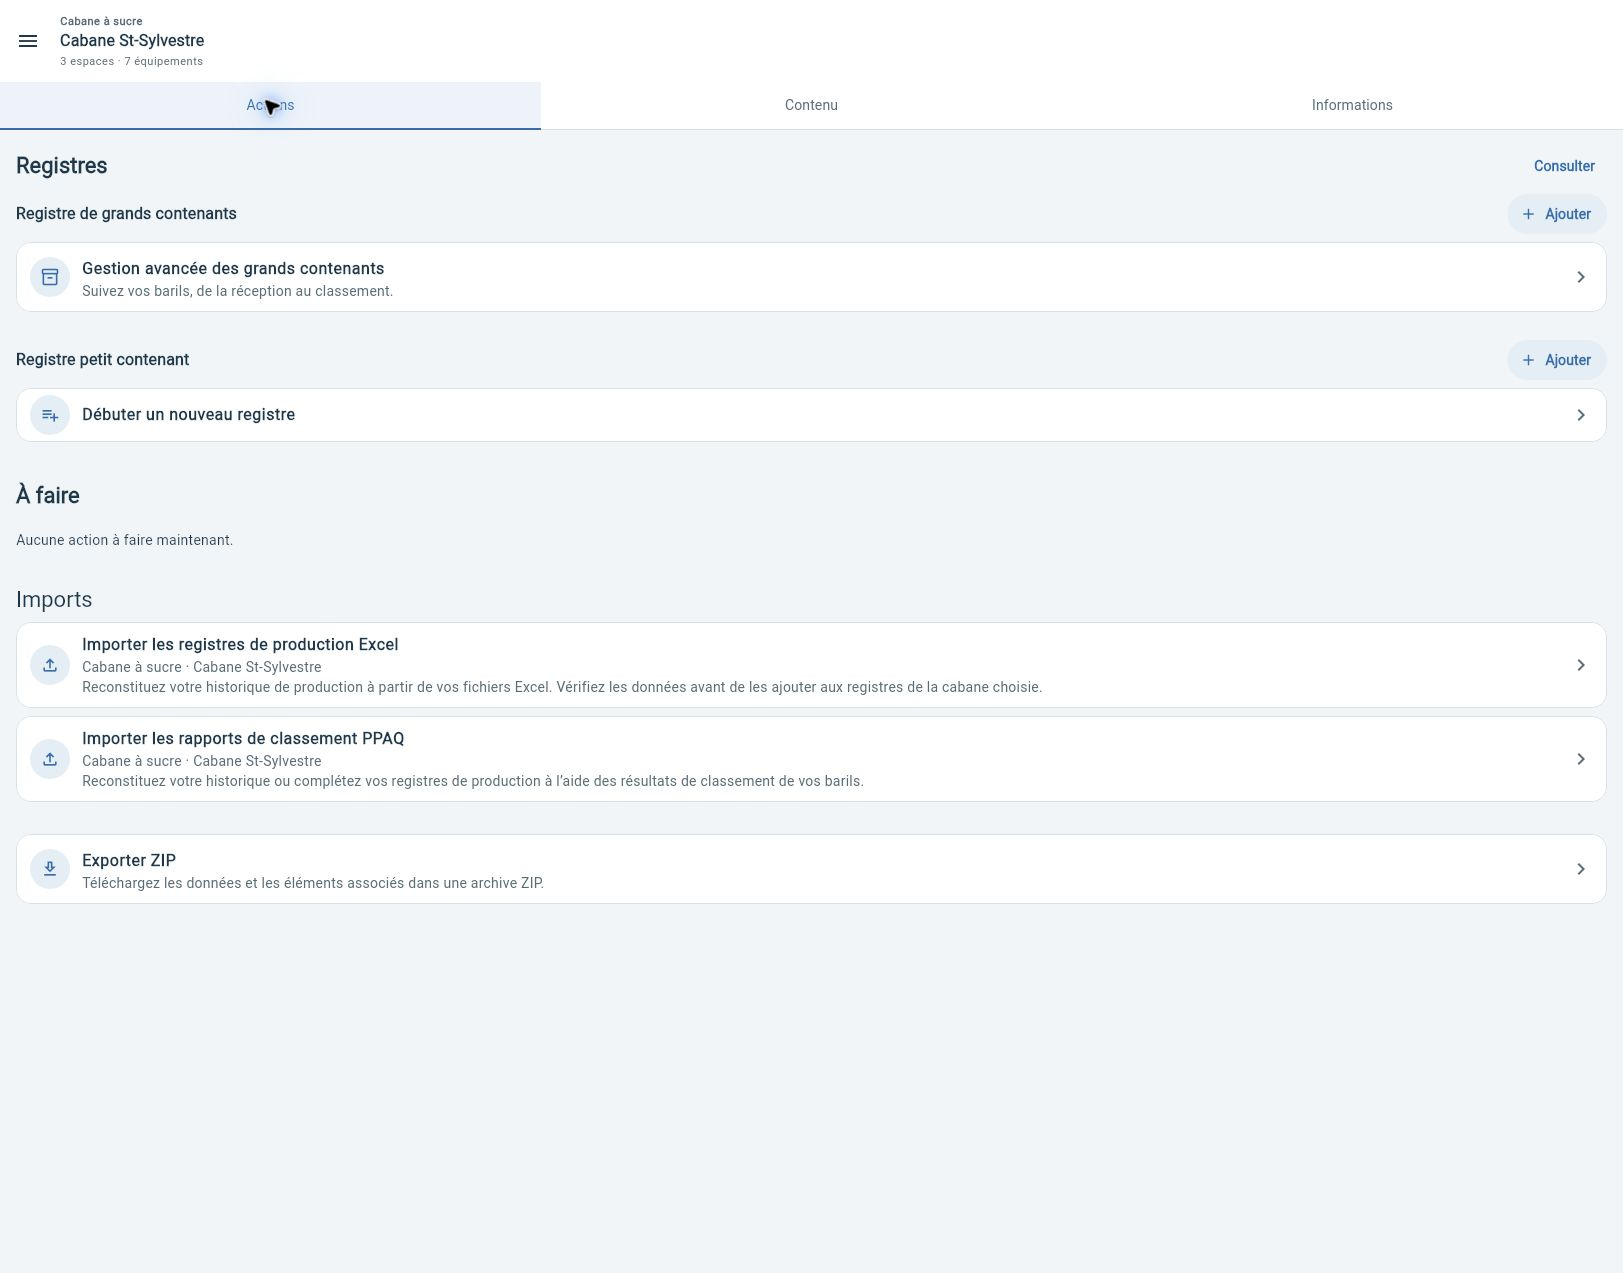
From the business, open a sugar shack or woodlot in Content. Then use Actions for that place’s tools.
L’Entailleur · Summer 2026 release
Practical landmarks for finding tools in the contextual interface.
01
From the business, open a sugar shack or woodlot in Content. Then use Actions for that place’s tools.
02
Open large containers from the sugar shack. Choose a register, filter barrels and open a container to view its history.
03
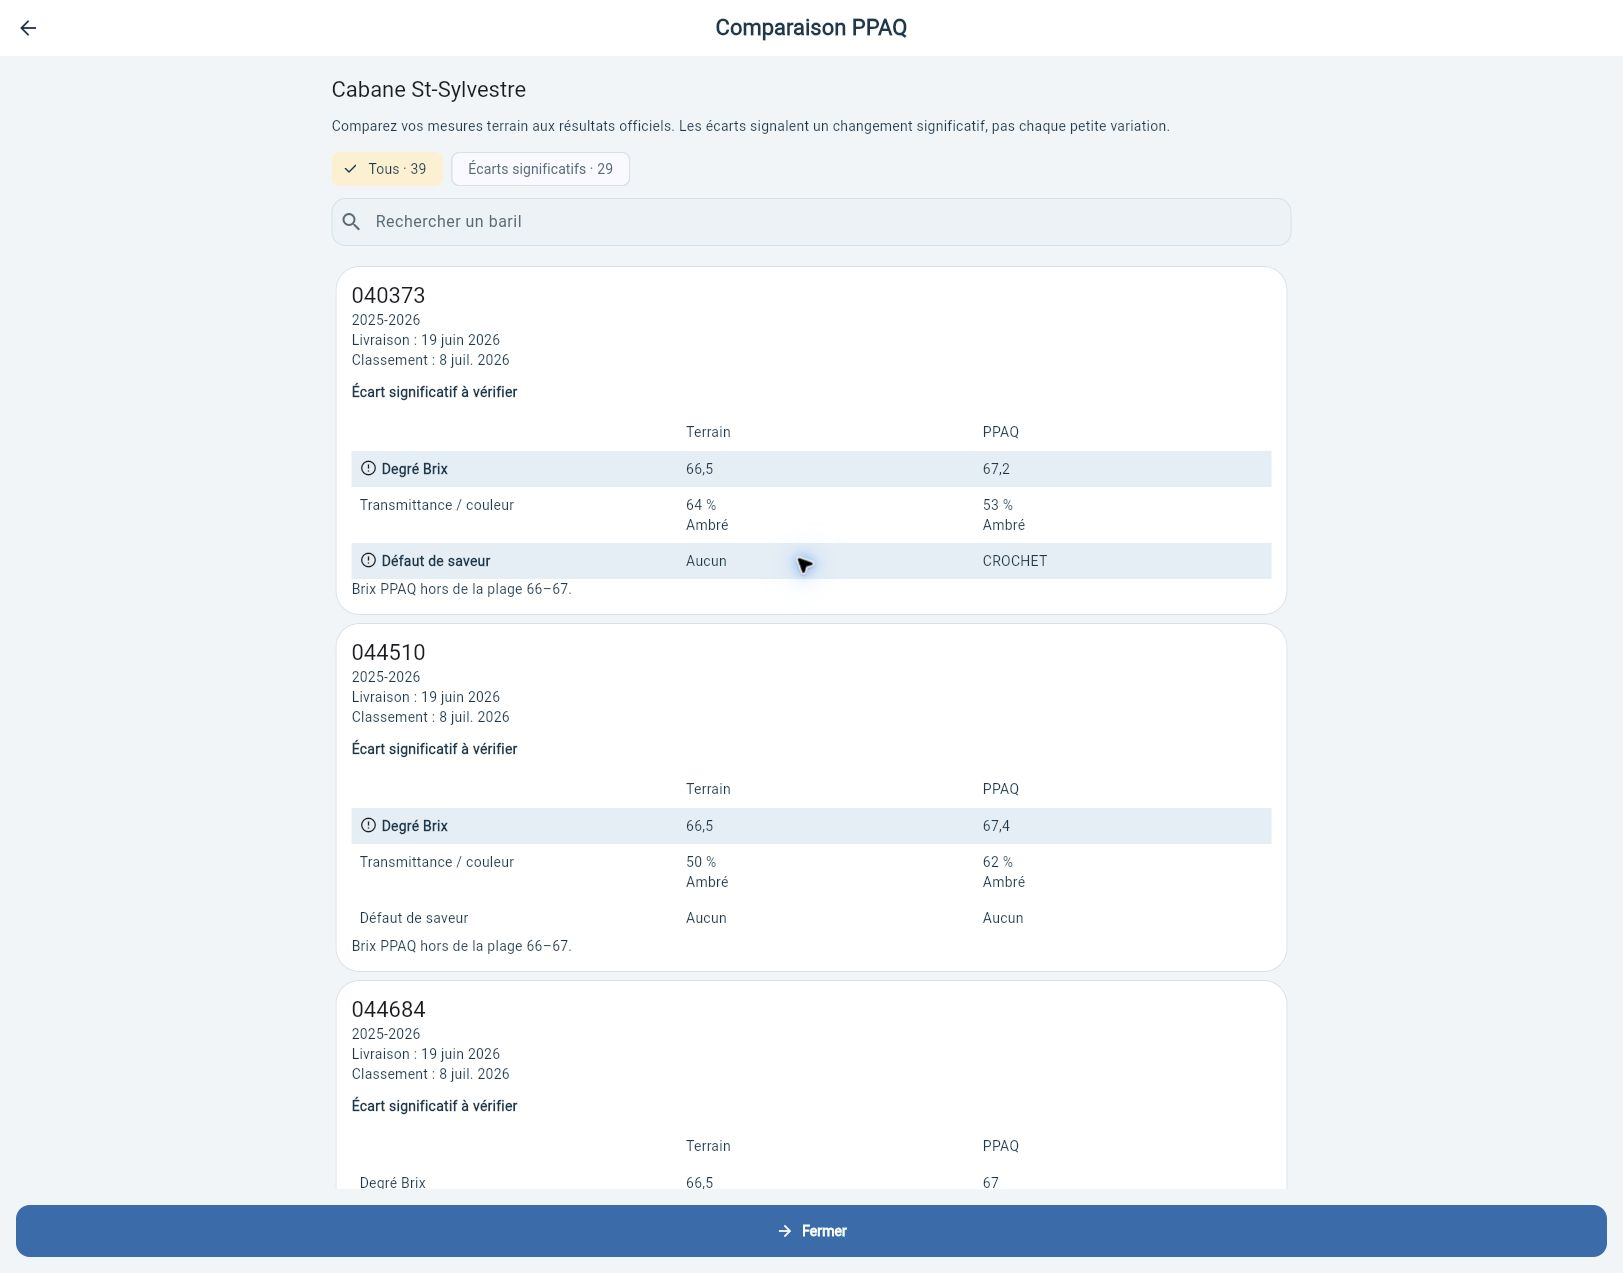
From large containers, open the grading comparison. View all barrels or only those with significant discrepancies.
04
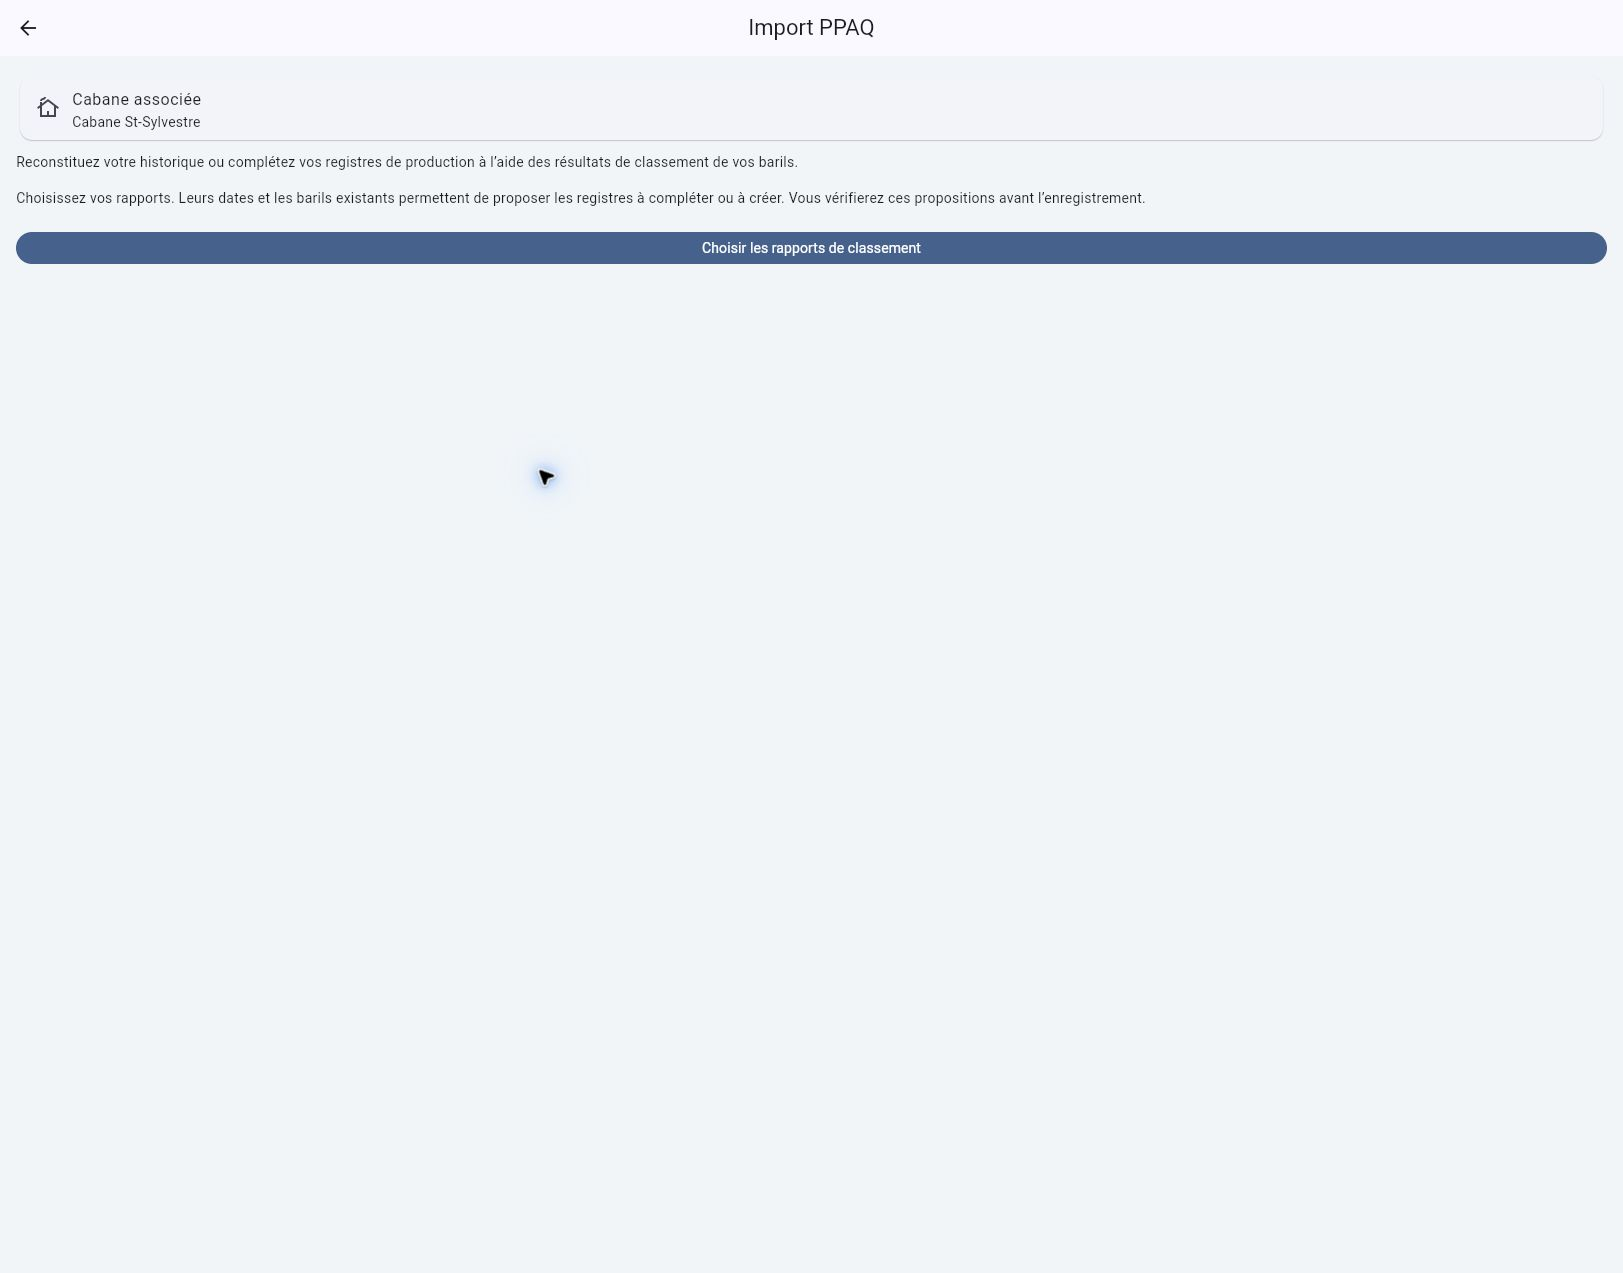
In Sugar shack → Actions, choose the large-container Excel import or PPAQ report import. Review the data before confirming any write.
Past registers remain available for consultation. For a new reception, check that a register covers today’s date; a disabled action does not mean the feature is gone.
An assistant organized into File, Settings and Review.
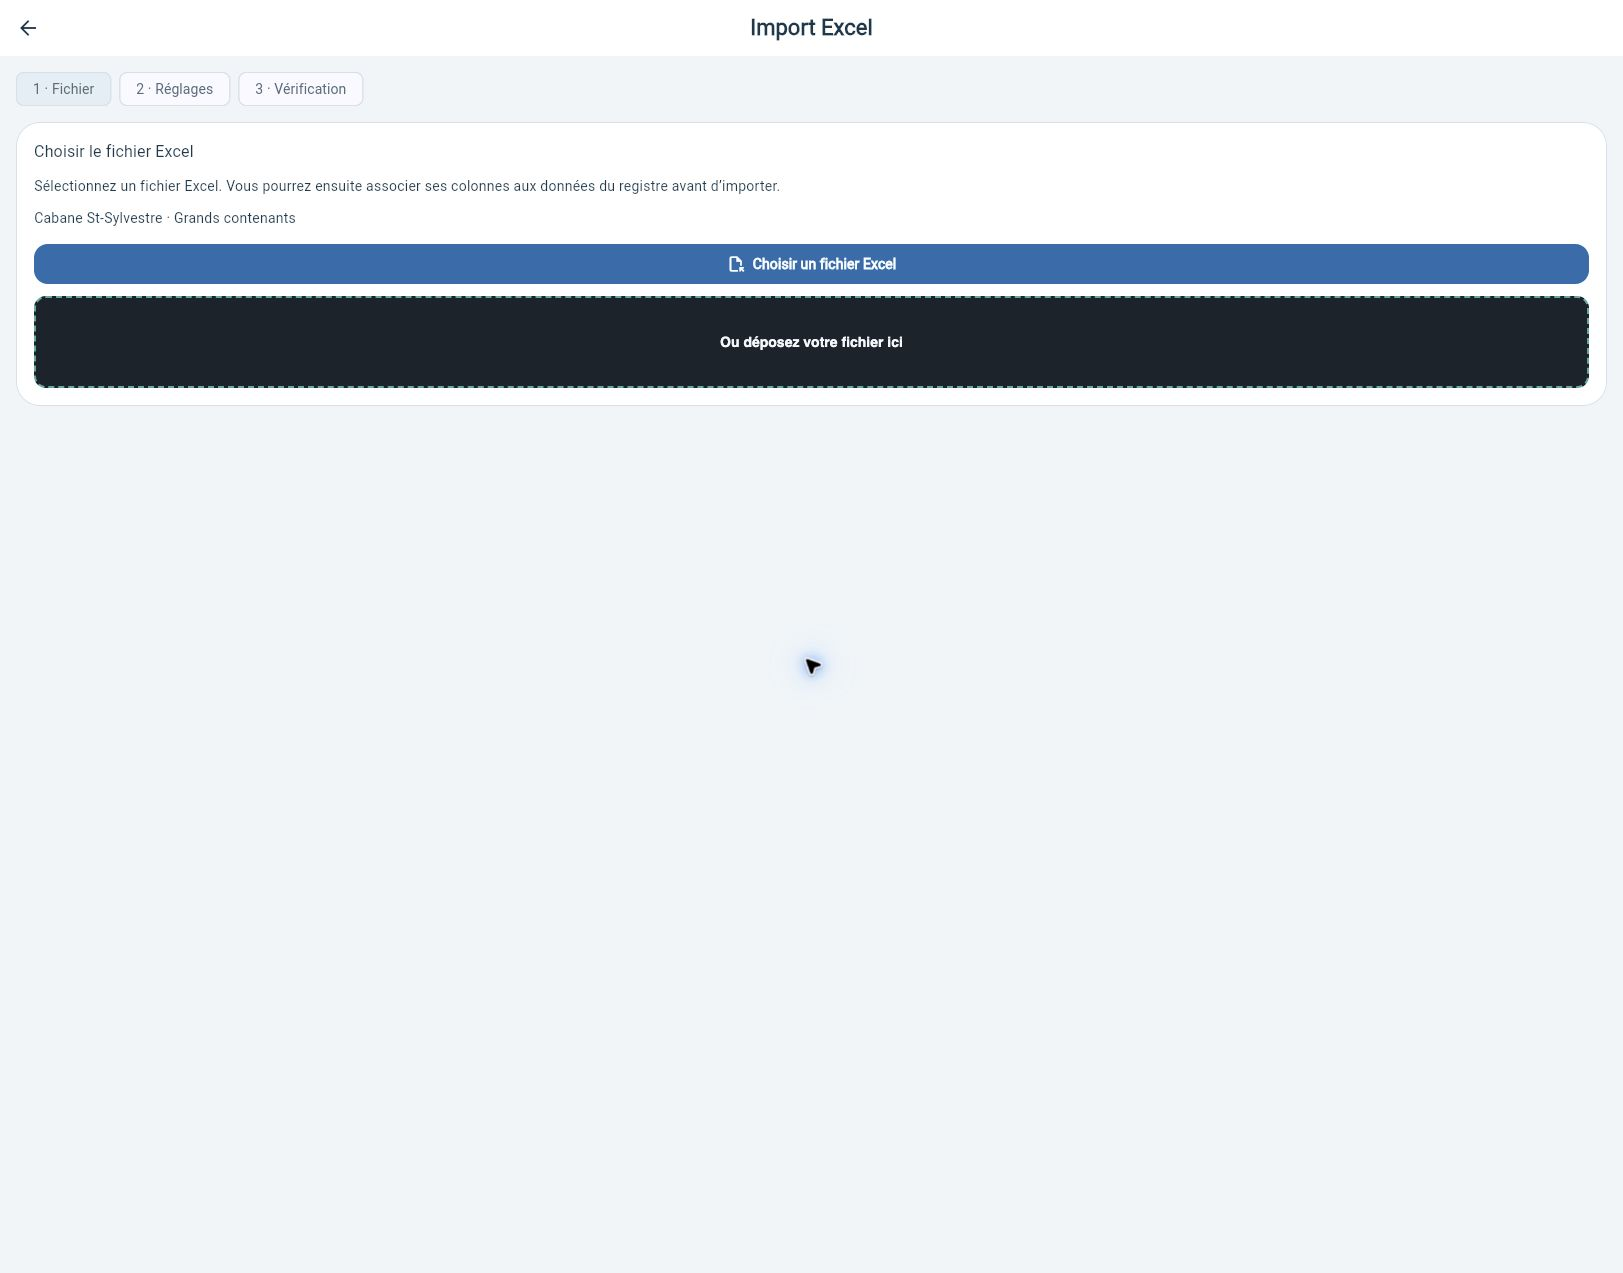
Excel and PPAQ imports are performed in the Web app with a subscription, not in the mobile app. Automatic retrieval of public lot data also requires a subscription. Screenshots show entry screens; file steps and results remain to be illustrated.
Choose the report to match with your containers.
Analysis is part of the barrel workflow. Compare Brix, transmittance and flavour defects; spot significant discrepancies and find delivery and grading dates.
06 / Yield and tools
Explore these three workflows in the new Web interface. Enlarge the screenshots to see the details.
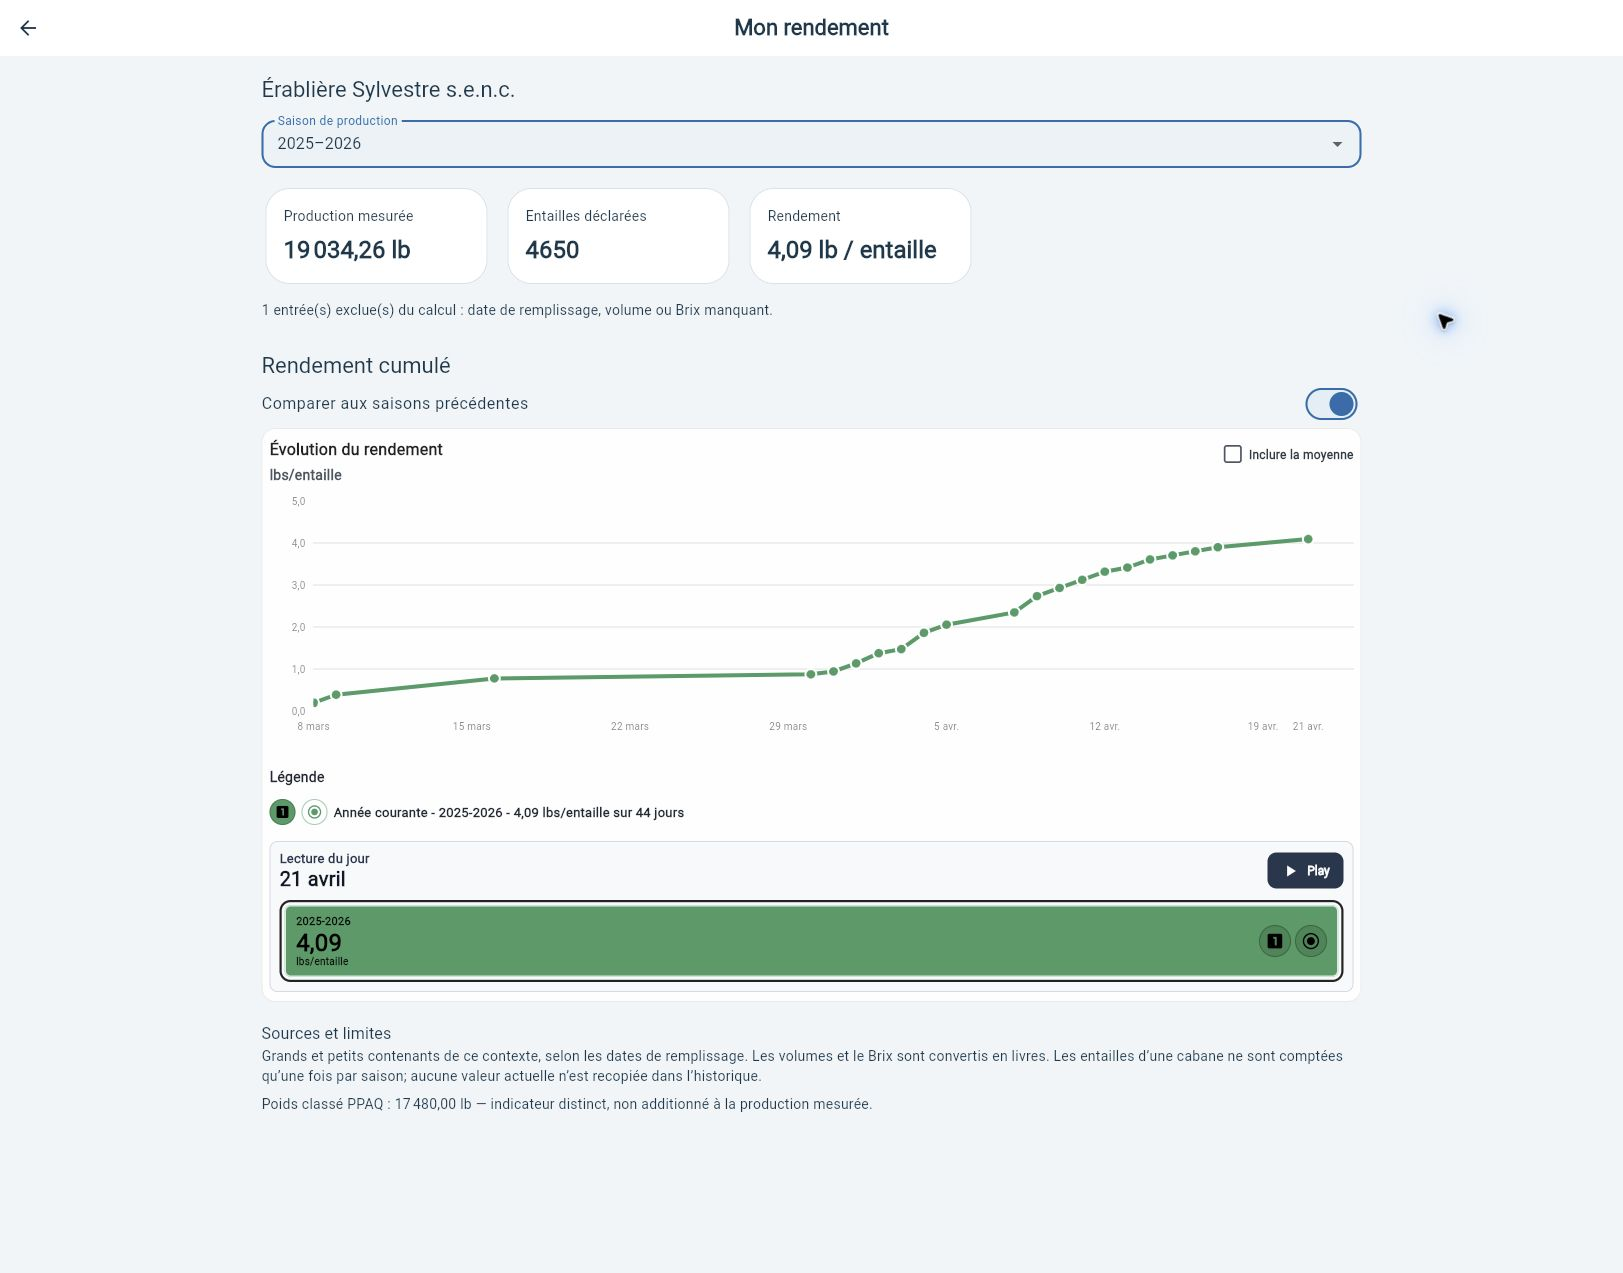
View cumulative production and yield per tap for the selected season. Incomplete data is flagged.
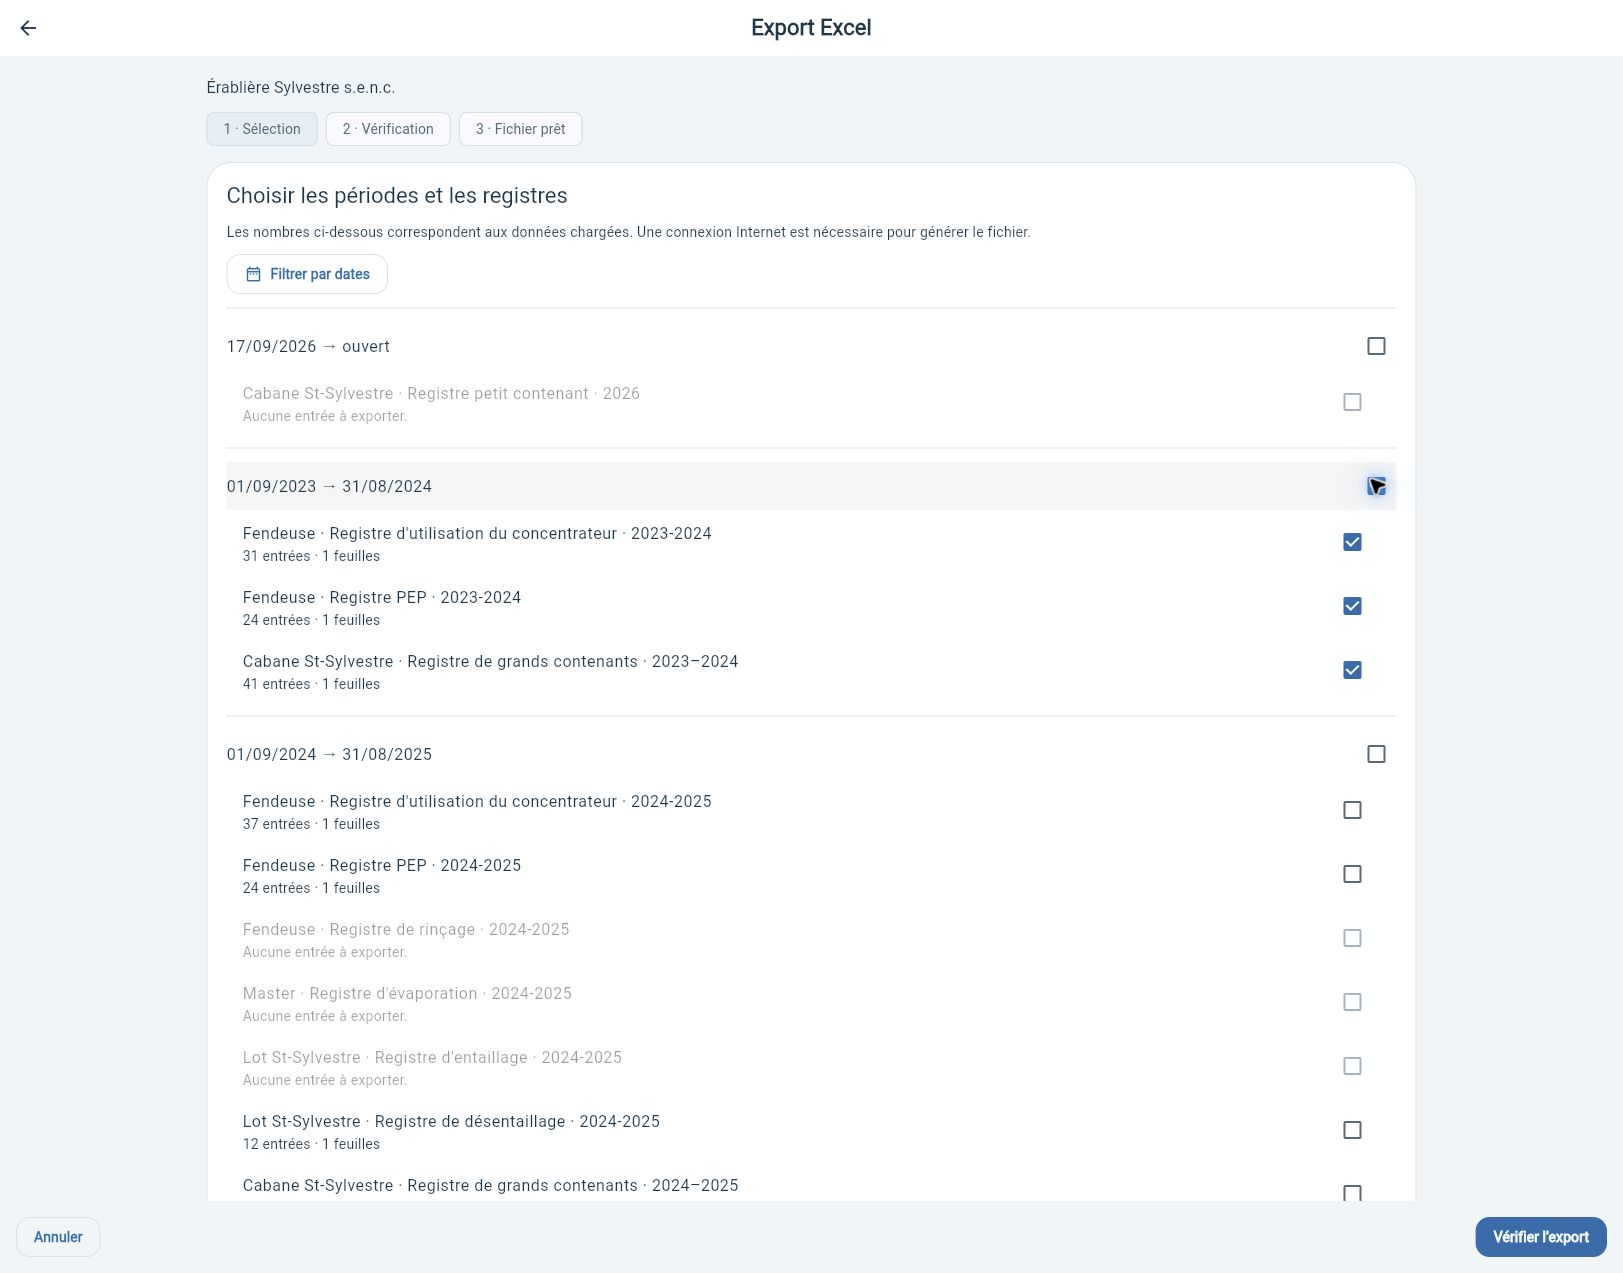
Choose the periods and registers to include in one workbook, then review your selection before exporting.
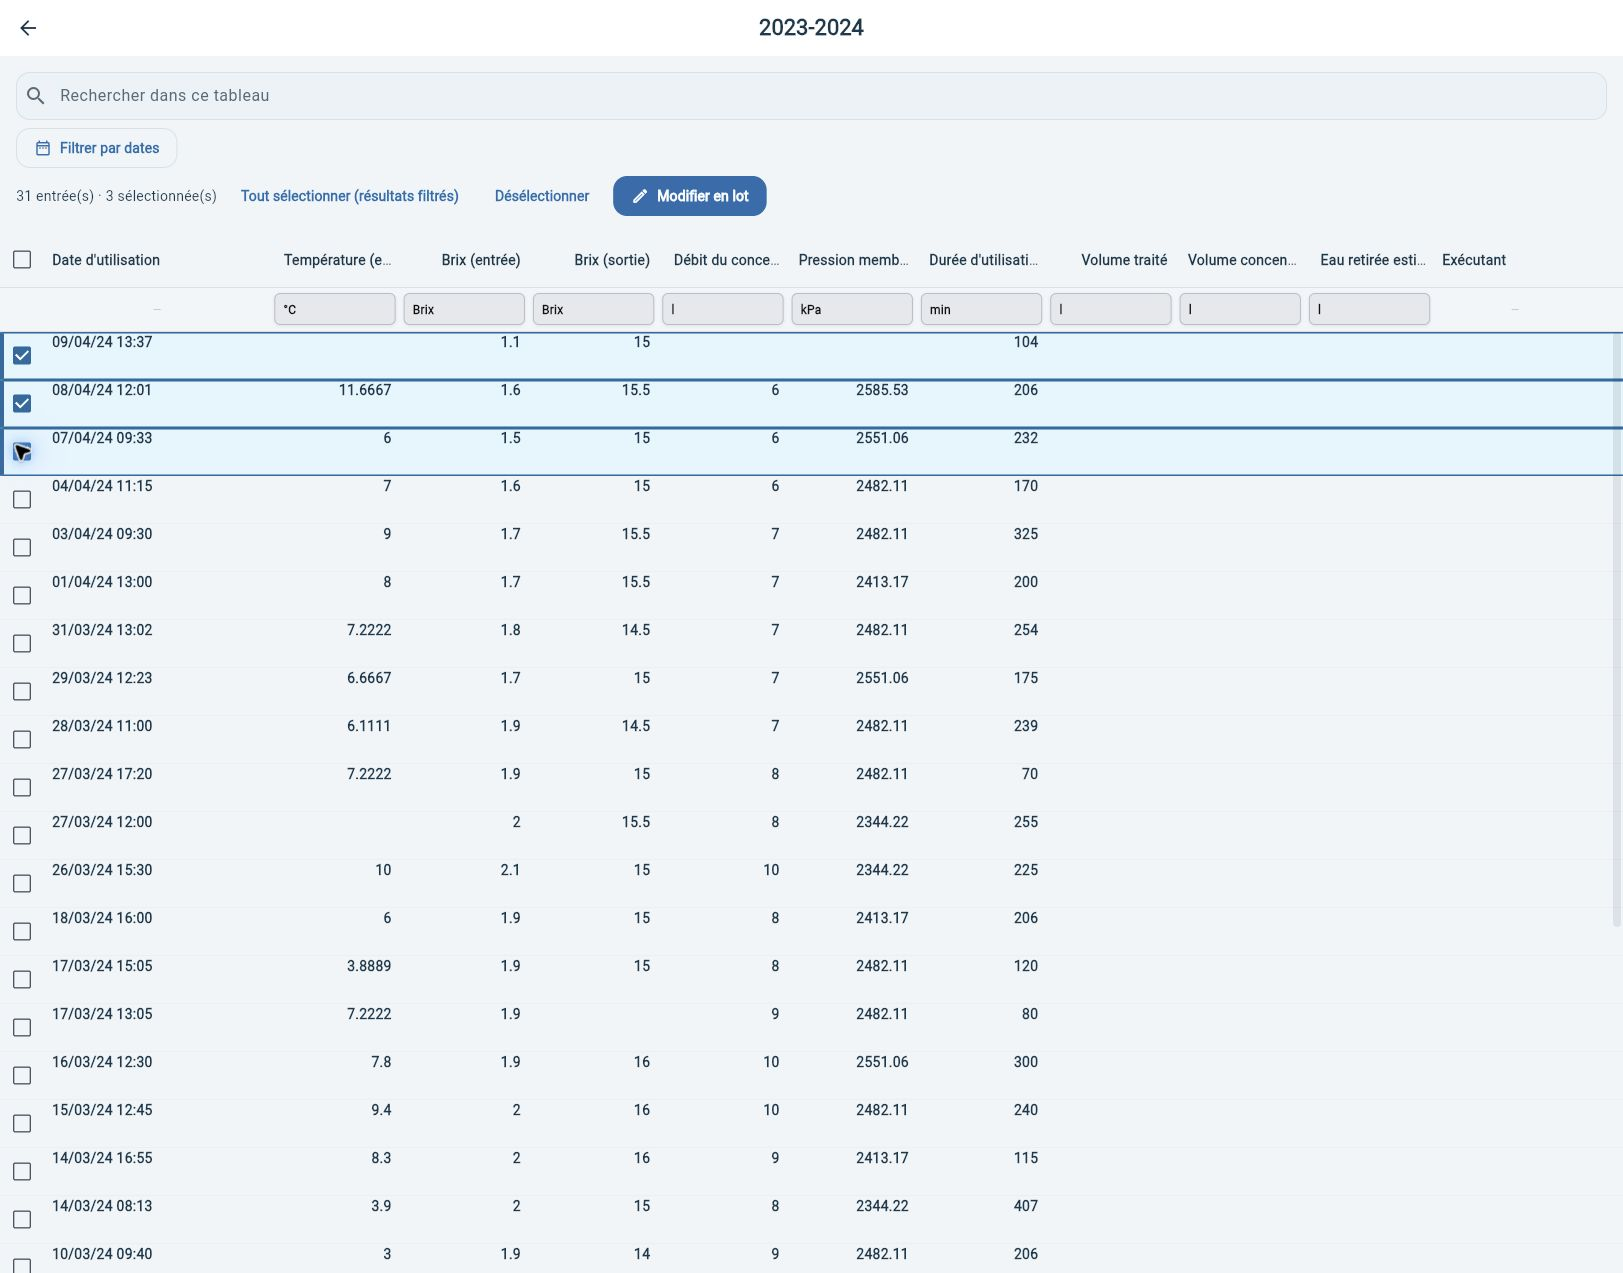
Select multiple table rows to access the bulk editing action.